


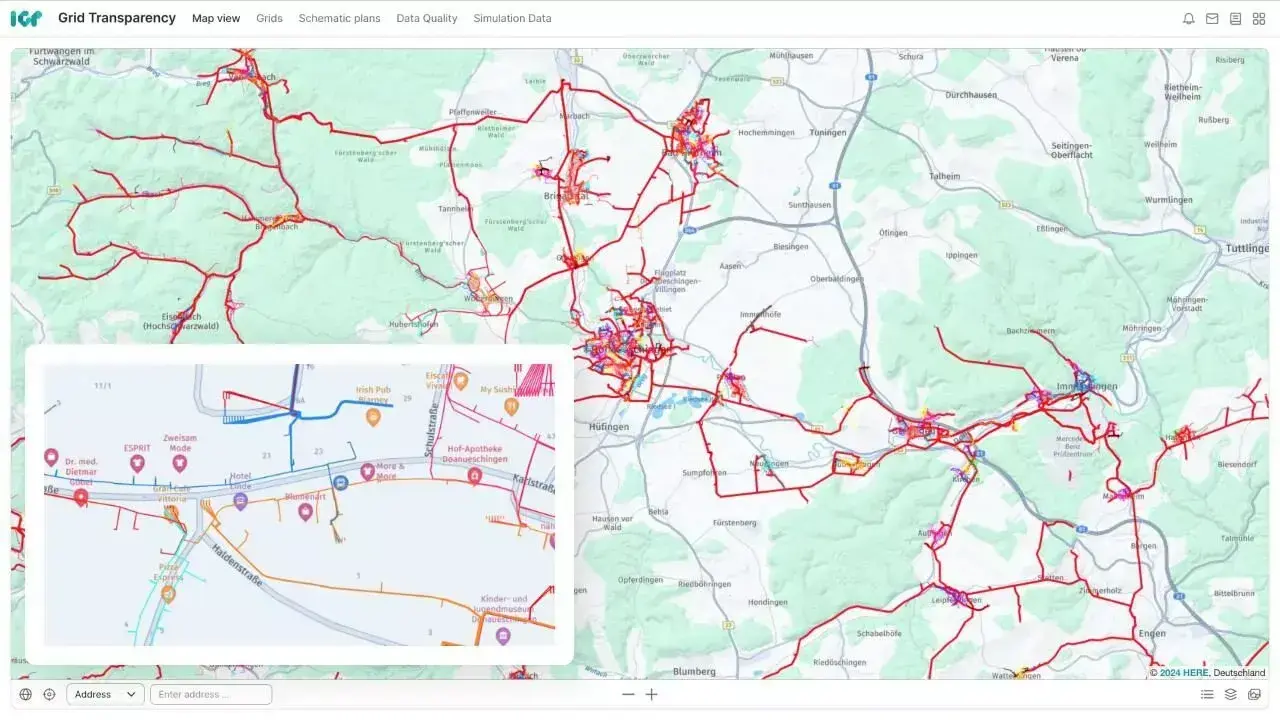
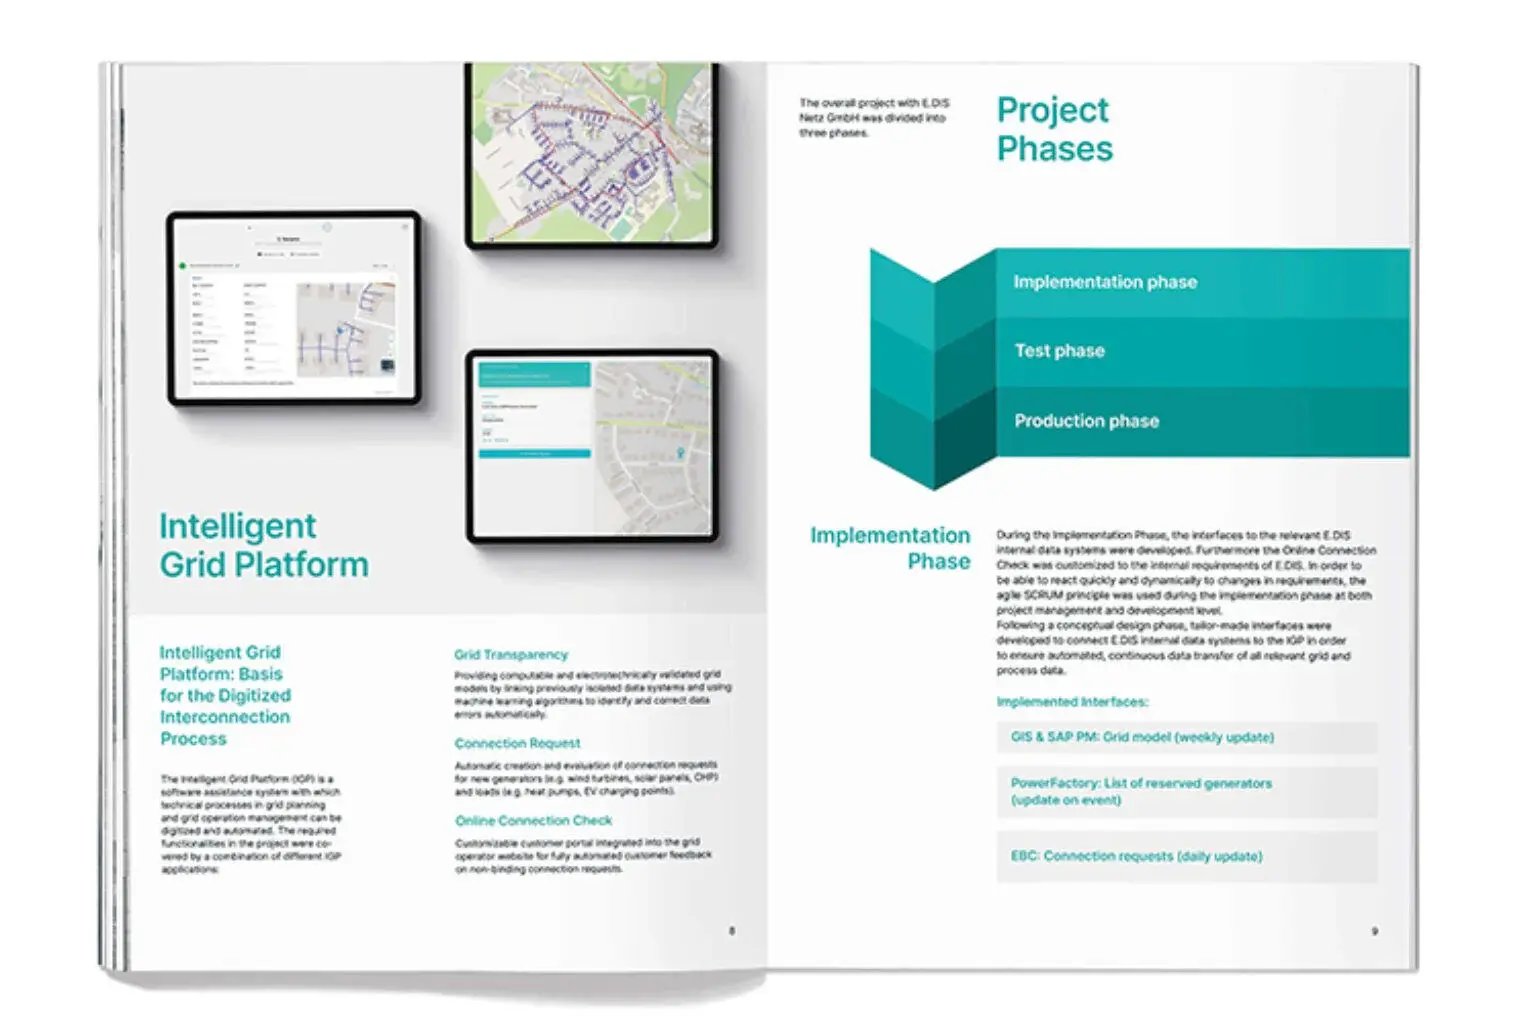
Grid Transparency
A georeferenced overview of the current grid situation and available grid capacity
Create a comprehensive, computational power grid model for all voltage levels, which places all your data into the relevant context and serves as the foundation for various simulations and calculations.
- Enhanced overview and understanding of the grid structure and topology
- True network visualization through the integration of other maps and data sources
- Automated simulations based on coincidence factors or time series
- Configurable input variables and threshold settings
- A centralized overview of all relevant system information from planning and operations, including targeted analysis with filtering and sorting functions
- The network model is automatically updated with changes in source data, ensuring it remains current and reliable
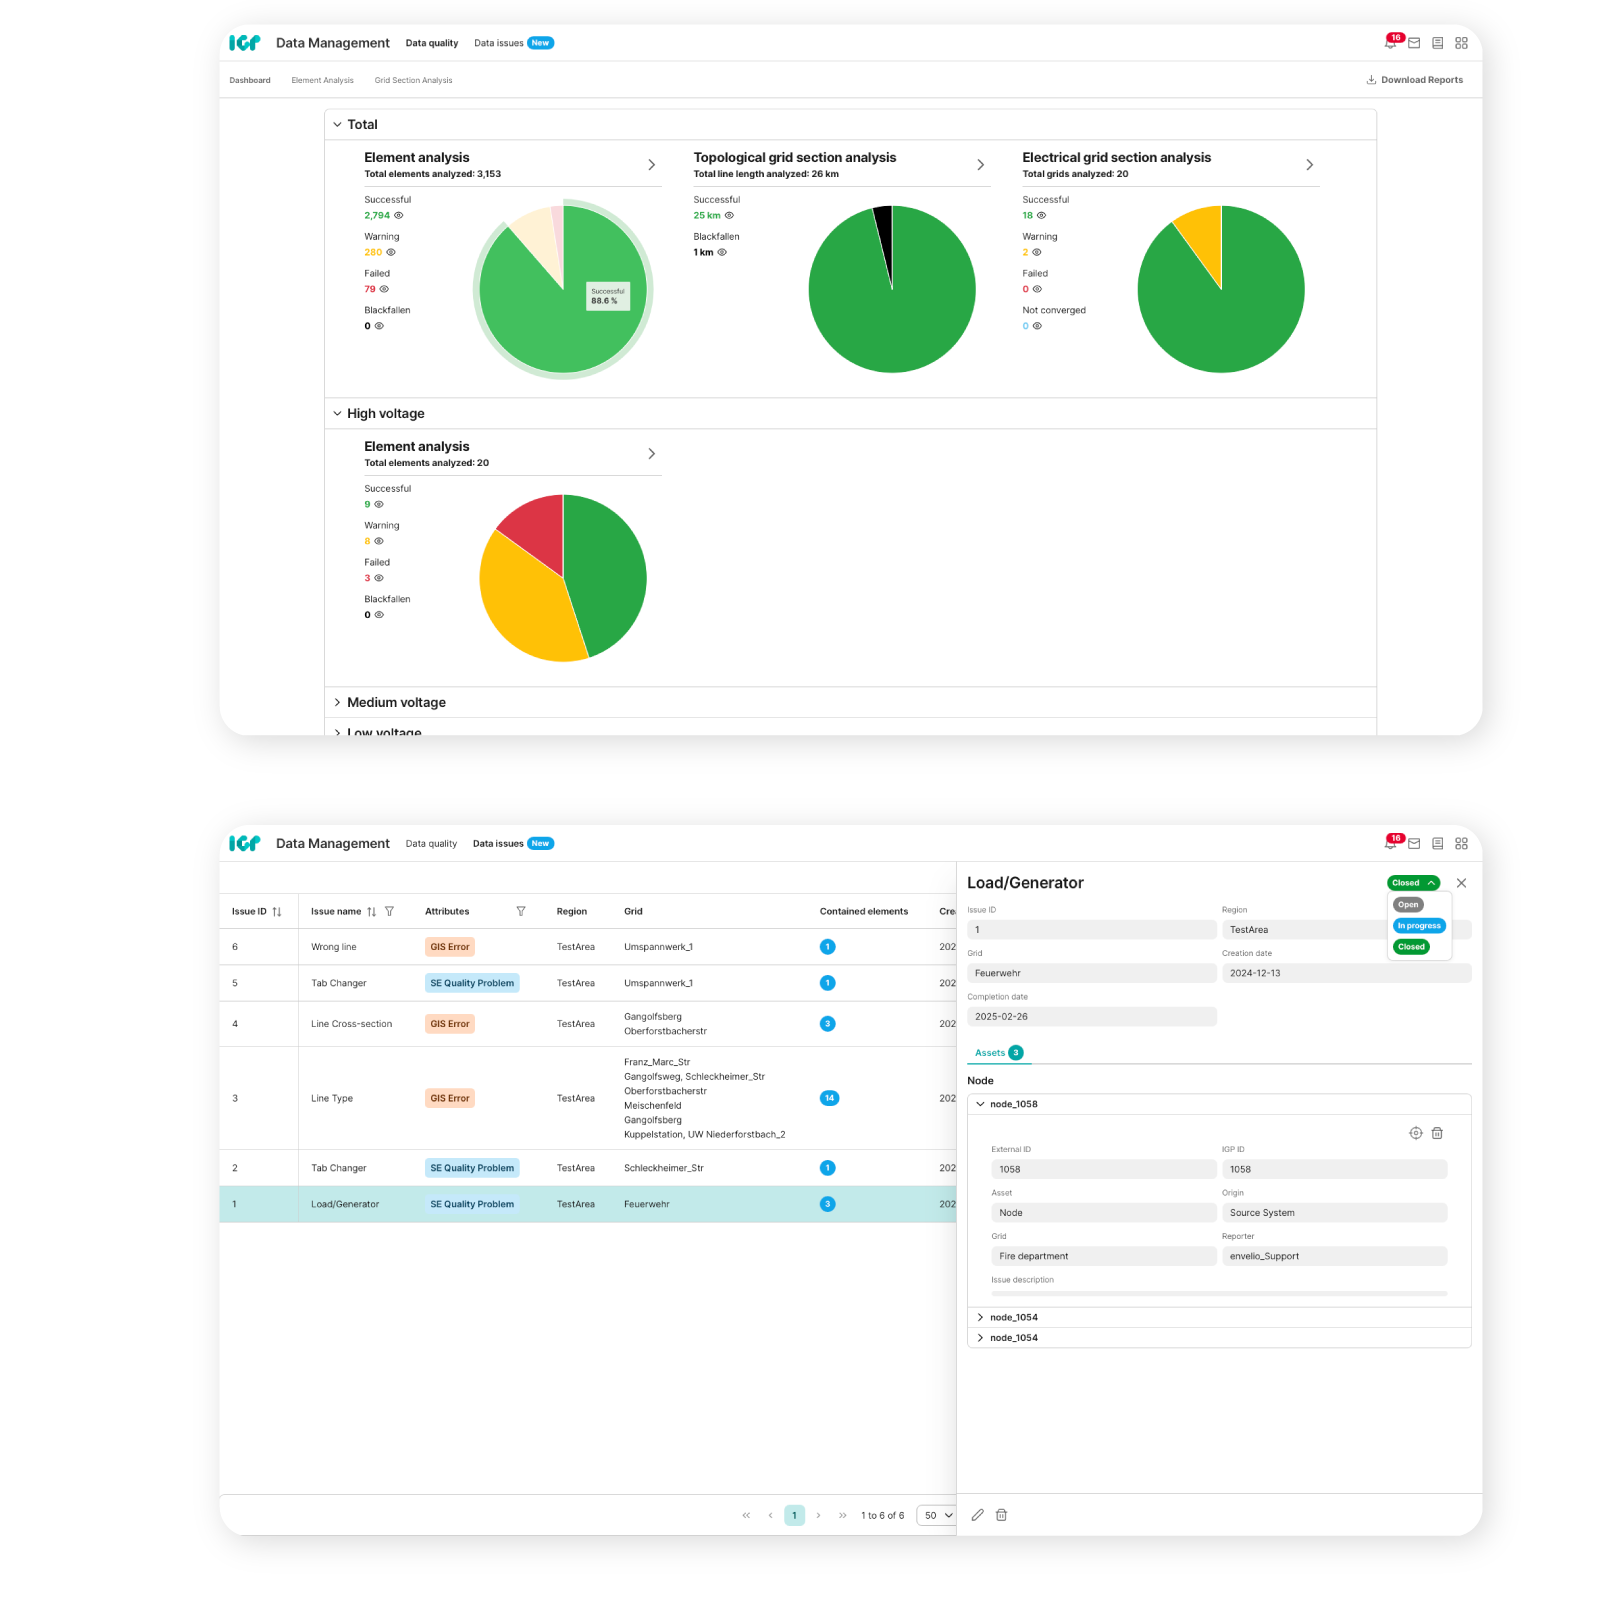
Data Manager
Detailed overview of current data quality and instant reporting of data issues
No more isolated systems or tedious manual maintenance: Our platform links your data sources automatically, delivers well-structured reports and helps you quickly improve your data quality. If any data seems off, you can use the "Report data issue" feature to notify the responsible department, so potential problems can be detected and resolved early on. This way, you avoid making decisions based on faulty data.
- Secure data integration through automated quality check
- Automatic generation of clear reports, e.g. with a list of all disconnected network segments
- Easy and structured compilation of data issues within the IGP, using the report feature or automatic routines, such as elemental testing
- Reporting incorrect data, for example related to switch positions, incorrect inner wiring, or wrongly assigned sensor systems
Convenient issue processing status in the database for an easy progress overview
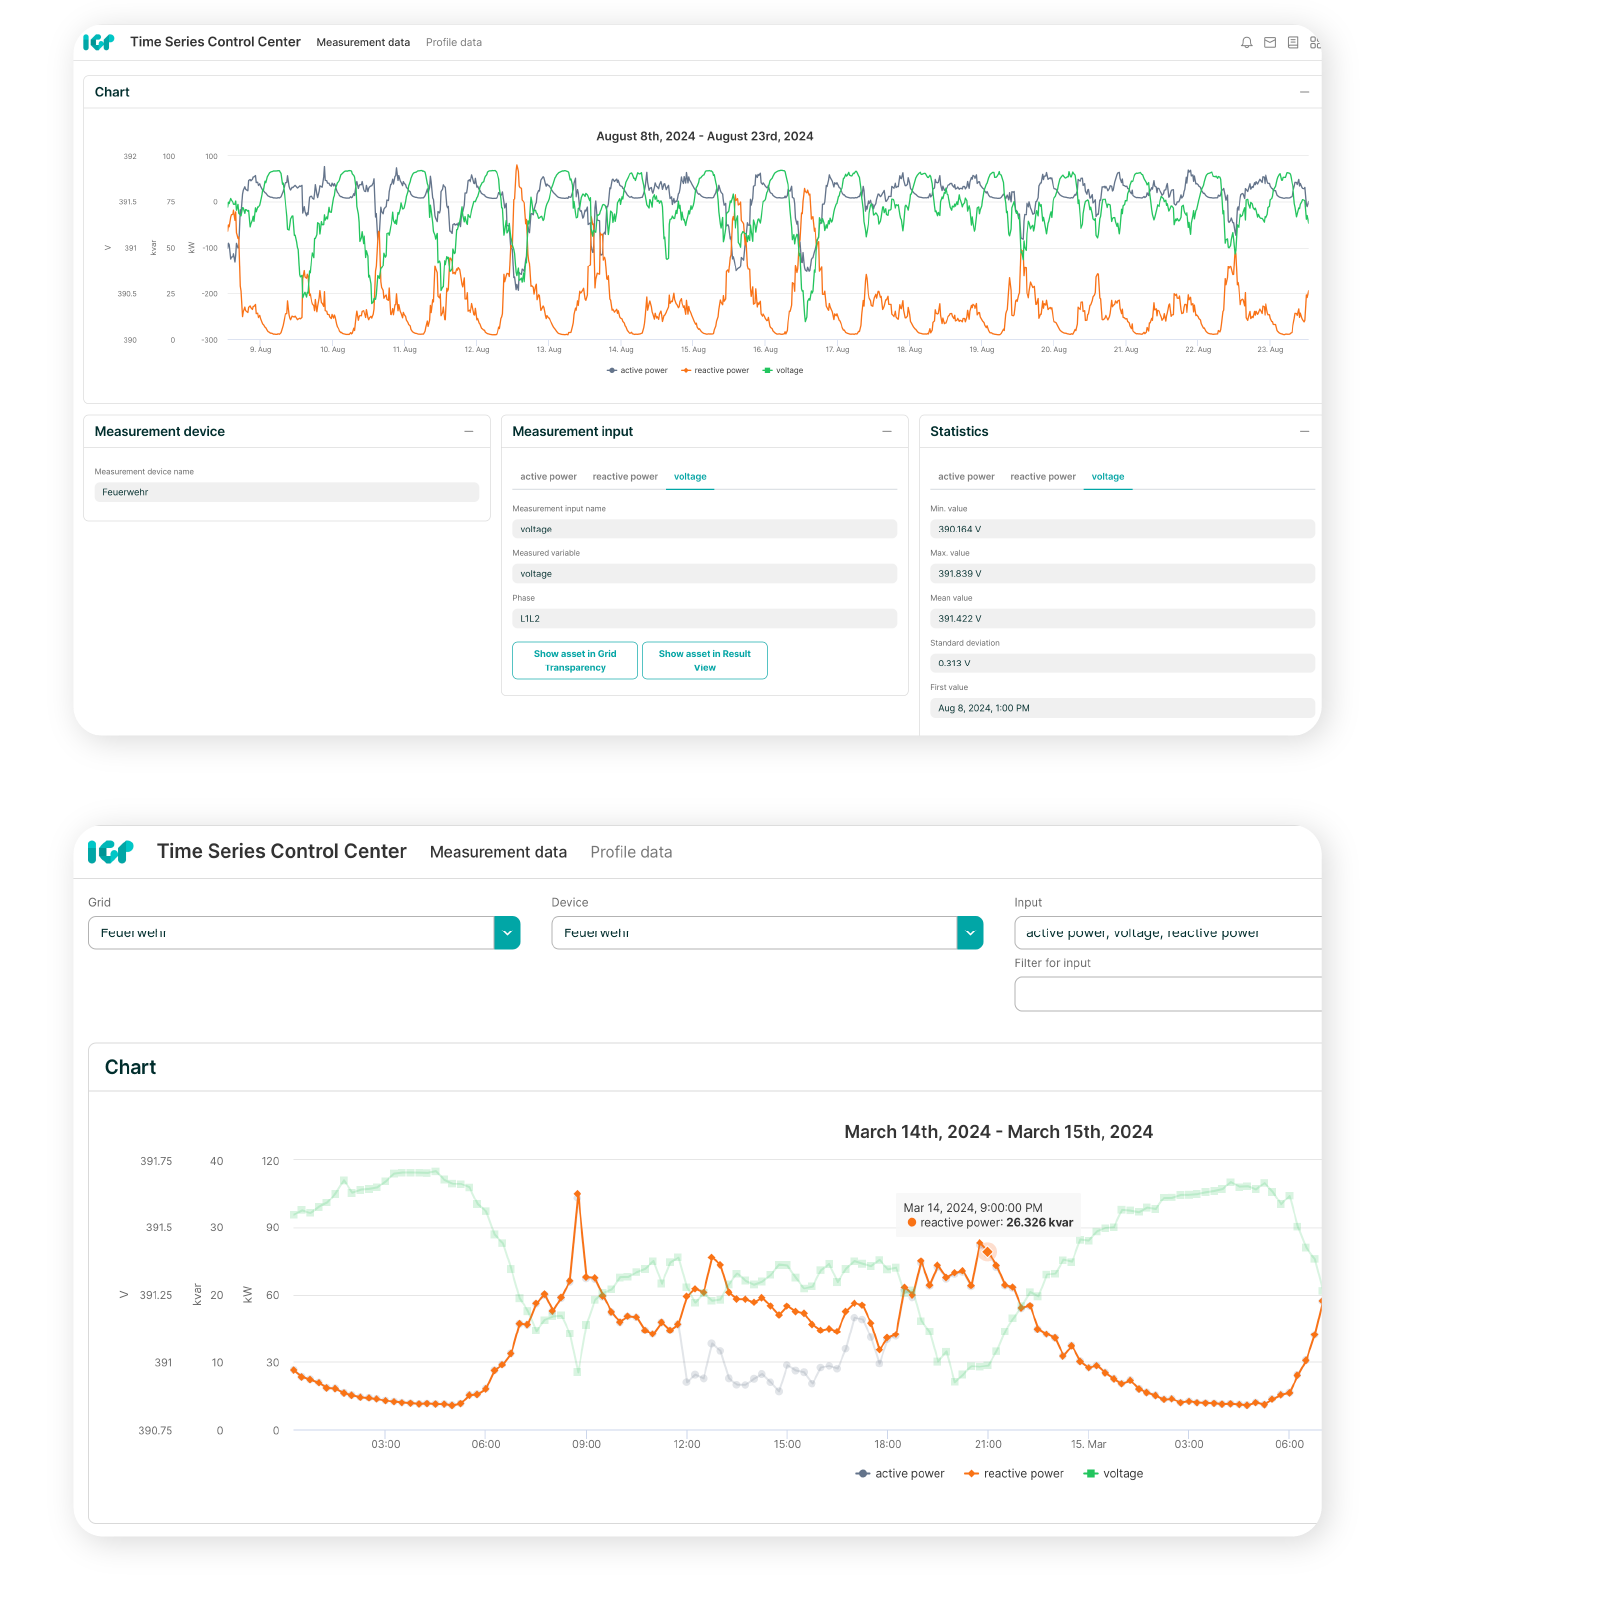
Time Series Control Center
Comprehensive analysis of real-time and historical measurement data
Consolidate measurement data from different sources into a centralized and standardized database, making it accessible and usable for your network data management as well as for various processes in system planning and operation. Visualize the data in a standardized format to ensure it is consistent and easy to understand.
- Stay independent: Thanks to the flexible interface structure, any source system can be connected
- Assign all measurement data to specific assets and link it with the network model
- Validate data to ensure measurement devices are correctly integrated
- Analyze long-term voltage or load trends and better track real-time changes in power flows
- Early detection of potential problem areas in the grid through the analysis of extreme values
- Reliable input for strategic grid planning or real-time state estimation

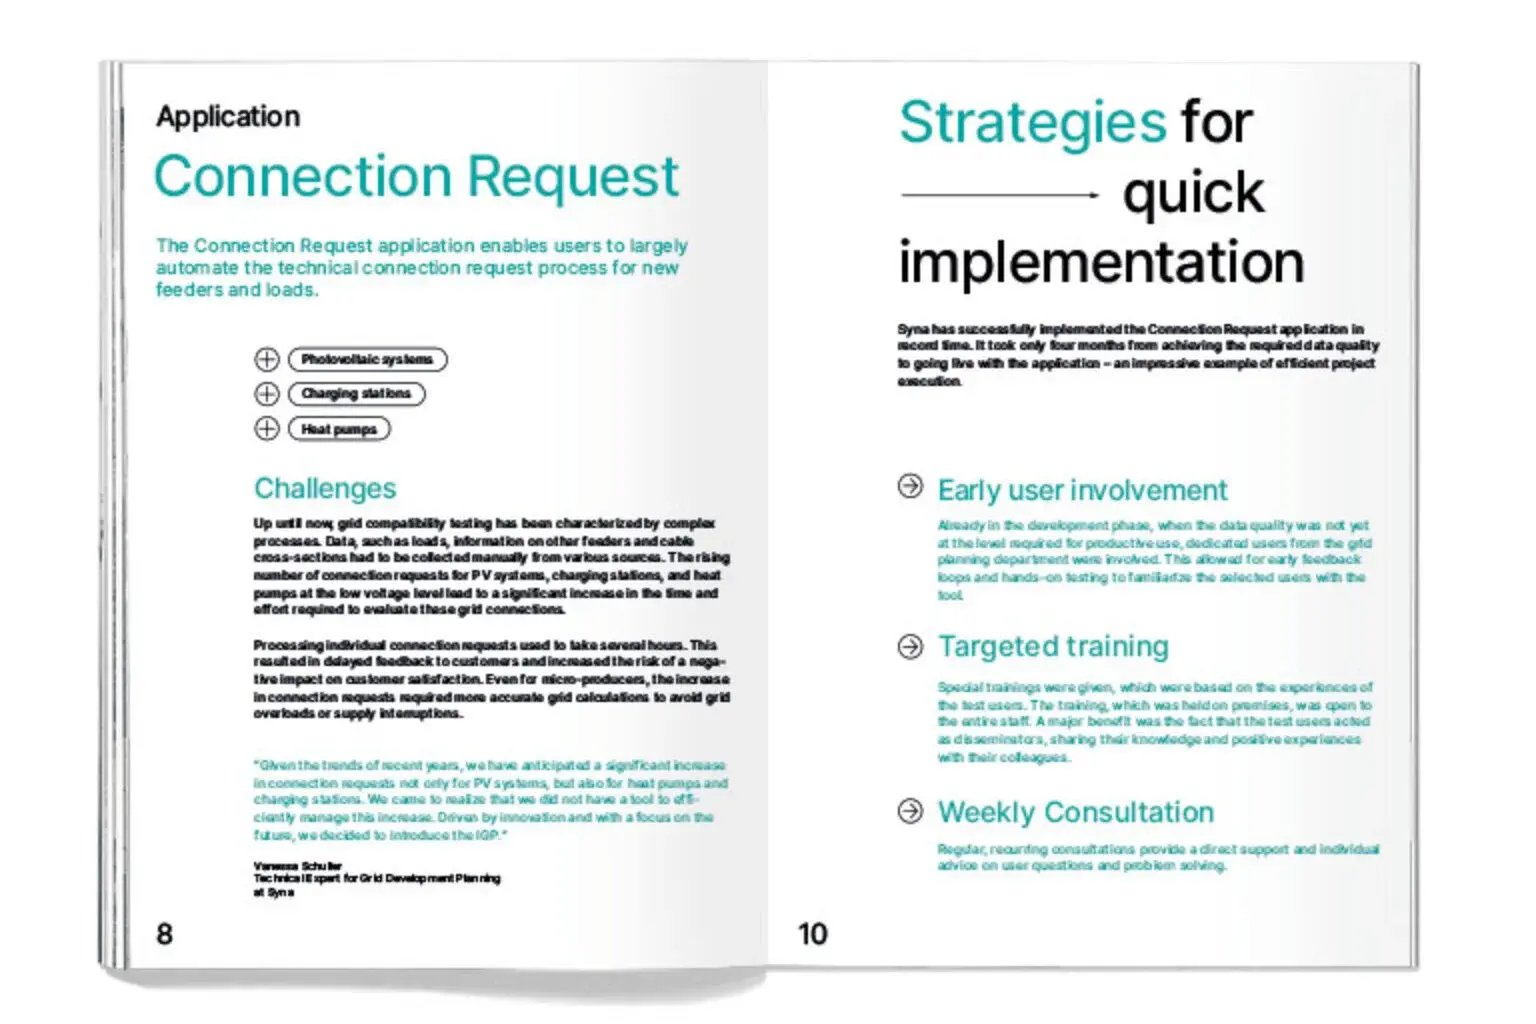
Grid Connection Navigator
Easily calculate capacity and interconnection costs – all in one tool.

Grid Upgrade Designer
Easily design new grid areas or plan changes to the existing grid
Case study: The Strategies of Readying Helsinki’s Power Grid for 2030 with envelio
Case study: Introducing a POI self-checker for end customers at E.DIS
White Paper: Scaling the Distribution
Interconnection Process